This is Part 4 of my series of four blog articles about trying the Oracle Cloud using the 30 day / $300 Free Trial offer. In this article, it is assumed that an Oracle Big Data Cloud Service has already been provisioned as described in Part 3 of this blog series.
When the Oracle Big Data Cloud environment is provisioned a working Zeppelin Notebook service is automatically configured as part of the service.
Note – Oracle Big Data Cloud is based on an Oracle Hortonworks-fork and is different from the similarly named Cloudera-based Oracle Big Data [in the cloud] service. Hopefully the product names will become clearer and more distinct in the future.
This is not meant to be a comparison between Jupyter Hub and Zeppelin Notebooks, but clearly the two technologies are catering for the same requirement, providing a multi-user data-science / analytics environment. In my opinion the main advantage of Zeppelin Notebooks versus Jupyter is the ability to easily execute different command types within a single notebook. Jupyter Hub probably has a bigger user-base, however and is becoming the defacto interface for Python users.
Log In to the Zeppelin Console
To log in to the Zeppelin console as the main administration user, go to the following URL in a web-browser:
where is the public IP address of one of the cluster nodes.
Connect as the user bdcsce_admin, using the admin password previously set up when the cluster was provisioned (as in Part 3).
For details on setting up multiple Zeppelin users , see here: https://zeppelin.apache.org/docs/0.6.0/security/shiroauthentication.html and here: https://shiro.apache.org/tutorial.html
Zeppelin Main Console
Once connected and logged-in the Apache Zeppelin main console looks something like this: 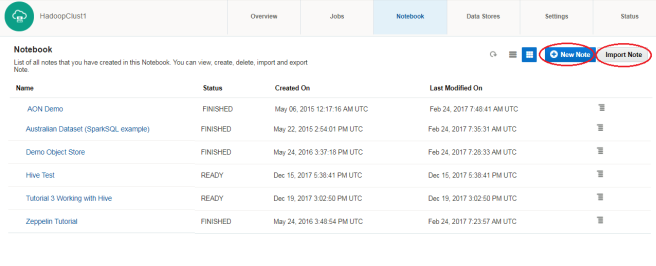 From this console screen you can either Create a New Note or Import a Note by selecting the appropriate button as highlighted above.
Zeppelin Quickstart Tutorial
I have created some basic 101-Zeppelin notebooks for an easy introduction to Zeppelin notebooks. There are two notebooks, Tutorial 1 Notebook Basics and Tutorial 2 Working With Hive covering the following operations:
- Basic navigation around the Zeppelin notebook web interface
- Different interpreters available: this includes Scala, Python, R, SQL and R as part of the Oracle Zeppelin server default install.
- combining UNIX Shell commands and other commands such as Hive, Python etc in a single notebook
- A simple Hive example working against a sample set of CitiBike Bike Trip Data
- staging data into HDFS from a remote web destination from within the Zeppelin notebook interface.
The notebooks can be cloned from here:
https://github.com/edbullen/ZeppelinTutorial
and then loaded into Zeppelin by selecting the “Import Note” button as shown on the previous screenshot.
To run the full tutorial, please download or clone the Zeppelin Notebooks – alternatively, edited highlights are listed below in the following two sub-sections.
Tutorial 1 Highlights
A Zeppelin note book is made up of multiple cells which have code that can be executed as series of commands. The output is displayed below the code for each cell. An example with Markdown mark-up and the resultant output in a single cell is shown below:
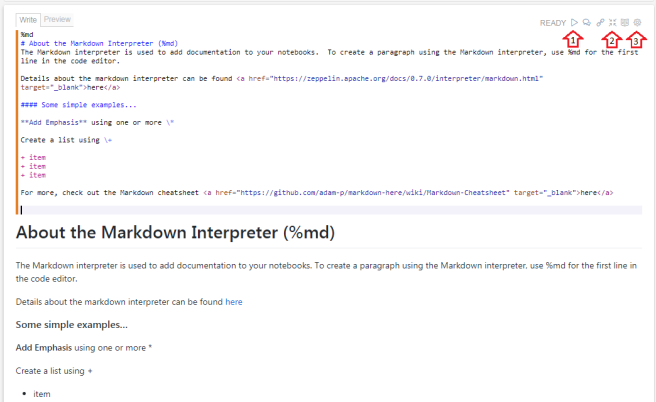
In the top right of each cell there is a line of icons to control actions against code / text in this cell. A subset of these are highlighted with arrows 1,2,3 in the image above where:
- Arrow 1 highlights the “Run” control to run the block of code
- Arrow 2 highlights the “Show/Hide” toggle to determine if the cell code is displayed (if not, only the output results are shown)
- Arrow 3 highlights the “Cell Settings” control, allowing multiple actions including re-sizing the cell, moving its position in the notebook, inserting a new cell and clearing the output.
Each cell in the notebook allows you to specify the type of command to execute (i.e. UNIX shell, Markdown, Python etc). The % symbol signifies the type of interpreter to use run the code that follows, EG:
- Markdown:
%md - Shell:
%sh - Spark with Scala:
%spark - Spark with Python:
%pyspark - Spark SQL:
%sql - Spark with R:
%r - JDBC:
%jdbc(hive)– use this for Hive queries.
EG 1 – Markdown
%md
# This is a Markdown Heading #
This is some text
EG 2 – Shell Commands
%sh
echo "running whoami"
whoami
echo ".."
echo "running pwd"
pwd
Tutorial 2 Highlights
EG 1 – Hive Query
%jdbc(hive)
select * from my_table;
EG 2 – Sourcing Data and Staging in HDFS
- Download the Bike Data and stage it in
/user/zeppelin/data/201612-citibike-tripdata - Use UNIX
wgetto a pipe, pipe tounzip, then pipe unzipped stream straight into HDFS.
%sh
hdfs dfs -mkdir ./data
hdfs dfs -rm ./data/201612-citibike-tripdata.csv
wget -qO- https://s3.amazonaws.com/tripdata/201612-citibike-tripdata.zip \
   | gunzip - \
   | hdfs dfs -put - ./data/201612-citibike-tripdata.csv
EG 3 – Load Data into Hive Table from HDFS
%jdbc(hive)

drop table if exists bike_trips;

CREATE TABLE bike_trips (
TripDuration int,
StartTime timestamp,
StopTime timestamp,
StartStationID string,
StartStationName string,
StartStationLatitude string,
StartStationLongitude string,
EndStationID string,
EndStationName string,
EndStationLatitude string,
EndStationLongitude string,
BikeID int,
UserType string,
BirthYear int,
Gender int
)
ROW FORMAT delimited
FIELDS TERMINATED BY ',' ;

LOAD DATA INPATH '/user/zeppelin/data/201612-citibike-tripdata.csv'
into table bike_trips;
EG 4 – Hive Query to Show a Chart with Stacks or Groupings
%jdbc(hive)

select dayofweek, gender, count(*) number_trips
from (select CONCAT(date_format(`StartTime`,"u")
       , '_'
       , date_format(`StartTime`,"E")
     ) dayofweek,
 case when gender=1 then 'Male'
      when gender=2 then 'Female'
      else 'Unknown' end gender
from bike_trips) bike_times
where dayofweek is not null
group by gender, dayofweek
sort by dayofweek asc
This generates a chart in-line in the note-book as follows:
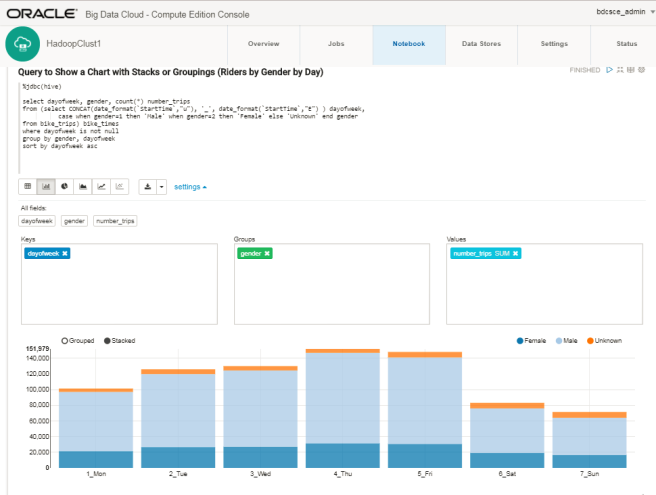
Use the settings link in the notebook cell (shown above) to adjust which data columns get included in the chart and use the chart-type buttons to specify the type of chart required.
Acknowledgments
These short tutorial examples are based on notebooks created by David Bayard and others at Oracle:
More advanced examples
A more advanced series of lab. tutorials and a sequence of Zeppelin notebooks can be found here:
https://oracle.github.io/learning-library/workshops/journey2-new-data-lake/
These tutorials cover Spark, Spark SQL, geo-mapping and streaming data into the Spark cluster using Oracle Event Hub Cloud Service (“OEHCS” AKA Kafka).
